Utility vs SolarPPA Comparison
Compare your utility costs against 0% and 2.99% escalation Power Purchase Agreements over 25 years
The Problem Most Homeowners Don't See Coming
Every month, you pay your electric bill without thinking twice. But what if we told you that over the next 25 years, you could be handing over six figures to your utility company?
Why Are Electricity Costs So High?
🏭 Aging Infrastructure
Power plants, transmission lines, and substations built decades ago require constant maintenance and upgrades—costs passed directly to you.
⚡ Fossil Fuel Dependency
Natural gas and coal prices fluctuate wildly based on global markets, politics, and supply chain disruptions. You're at the mercy of these forces.
📋 Regulatory Costs
Compliance with environmental regulations, grid modernization mandates, and peak demand management all drive rates higher.
💰 Profit Margins
Utility companies are businesses. Their shareholders expect returns, and rate increases are how they deliver them.
What Happens If You Do Nothing?
The answer is simple: You keep paying more. And more. And more.
You pay around $2,000-$3,000 annually. It stings, but it's manageable.
At 5% annual increases, you're now paying $3,200-$4,800 per year.
That's a vacation, a car payment, or a college fund contribution—going straight to the utility company.
You're paying $6,700-$10,000+ annually.
Over the full 25 years, you've handed over $100,000-$150,000+ that you'll never get back.
There's a Better Way: Keep That Money in Your Pocket
What if instead of writing a check to your utility company every month for the next 25 years, you invested in your own home? With solar energy, you can:
Lock In Your Rate
Stop the bleeding. Solar gives you predictable energy costs—no more surprise rate hikes.
Keep Your Money
Every dollar you don't send to the utility company stays in your bank account for things that matter to you.
Build Home Equity
Solar panels increase your property value while reducing your operating costs—a win-win investment.
Why We Built This Calculator
Most homeowners have no idea how much they'll pay in electricity over their lifetime. We created this tool to give you crystal-clear visibility into your true long-term costs—so you can make an informed decision about whether solar is right for you. Knowledge is power, and we believe you deserve to know where your hard-earned money is going.
Why 5% Annual Increase?
Based on official U.S. Bureau of Labor Statistics (BLS) data for Northeast Urban Electricity (Series ID: APU010072610)
Recent Acceleration
The last 5 years (2020-2025) have seen costs spike from $0.16/kWh to $0.25/kWh— an average of over 8% per year.
Our 5% projection is a conservative middle ground between the 47-year average (~3%) and the aggressive recent 5-year spike (8%+). This provides a realistic yet cautious estimate of your future costs.
Historical Electricity Price Trends (1978-2025)
Official U.S. Bureau of Labor Statistics data showing the consistent upward trend in electricity costs
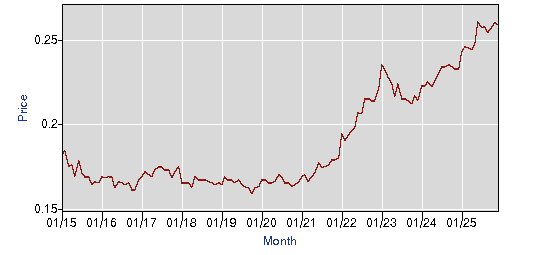
What this graph shows: From 1978 to 2025, electricity prices have climbed from $0.062/kWh to $0.252/kWh. While the long-term average increase is around 3%, recent years have seen accelerated growth, with the 2020-2025 period averaging over 8% annually.
Why it matters: This historical data proves that electricity costs don't stay flat. Our 5% projection accounts for both the steady long-term trend and the recent acceleration, giving you a realistic picture of what to expect over the next 25 years.
Where to Find Your kWh Usage
Look for these sections on your utility bill
National Grid Bill
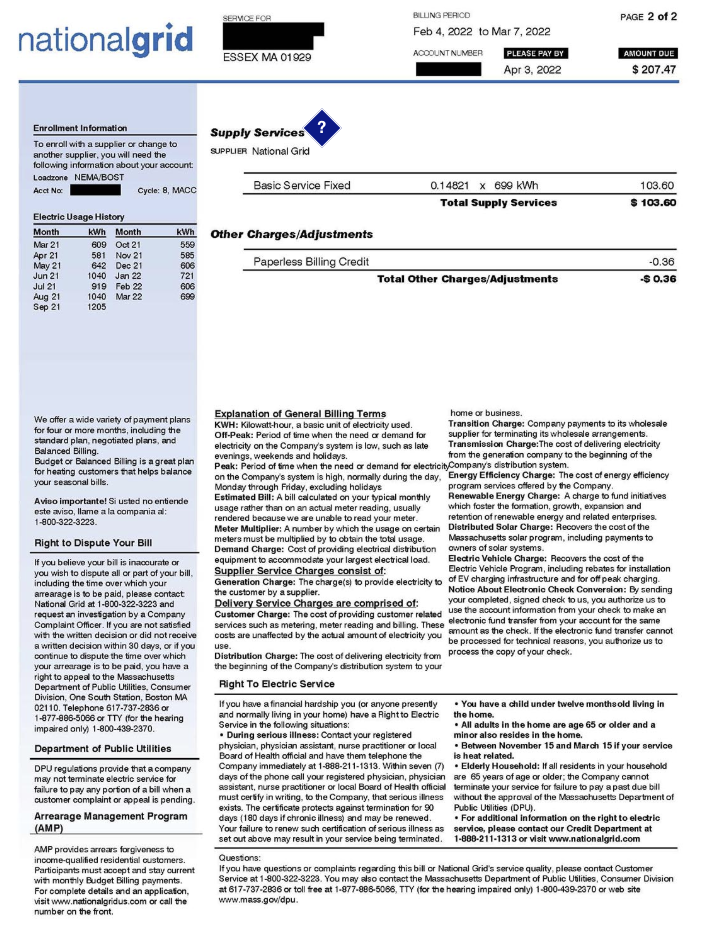
← Total Energy: 249 kWh
← Current Charges: $70.53
Look for:
"Total Energy" in the "DETAIL OF CURRENT CHARGES" section
Find the "DETAIL OF CURRENT CHARGES" section (middle of bill)
Look for "Total Energy" on the right side - this shows your kWh for this billing period
Check the "Electric Usage History" table on the left for past months
Eversource Bill
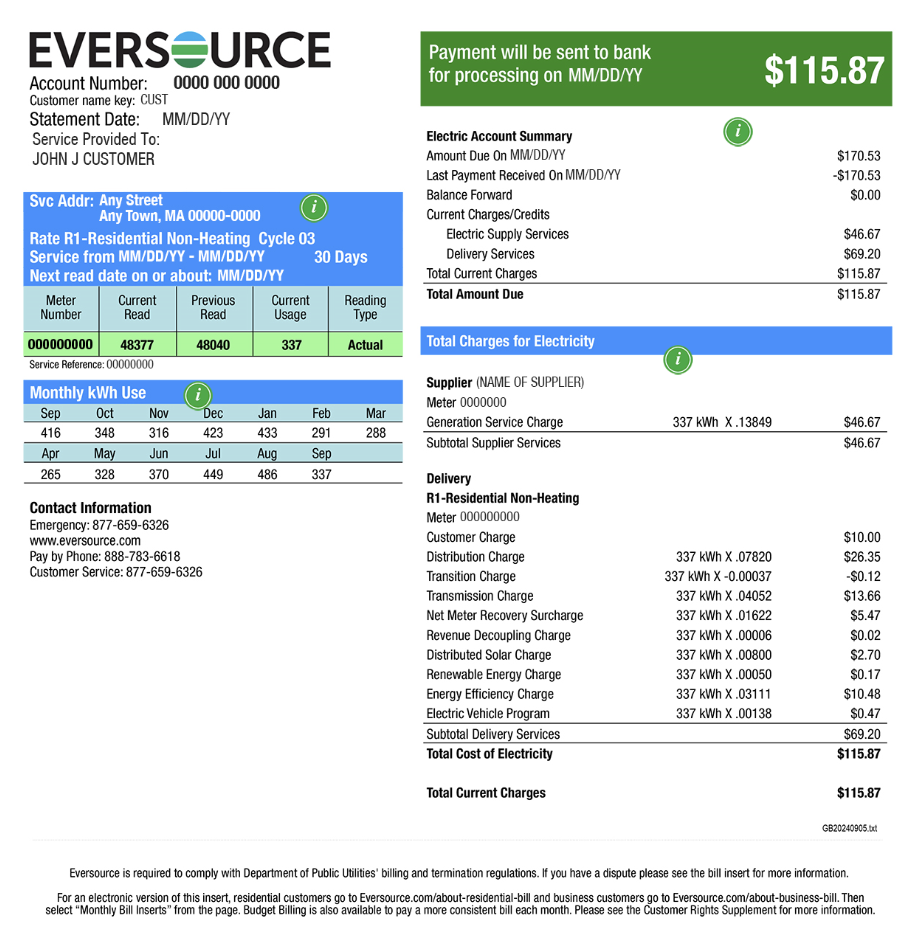
← Current Usage: 337 kWh
→ Monthly History
← Total Amount Due: $115.87
Look for:
"Current Usage" in the meter reading table
Find the meter reading table in the blue section at the top
Look for "Current Usage" column - this is your kWh for this billing period
Check "Monthly kWh Use" table on the left for a full year of historical data
💡 Pro Tip: Online Account Access
Most utility companies provide detailed usage history through their online portals or mobile apps. You can often download a full year of data as a CSV or PDF.
Can't find your kWh? Call your utility company and they can provide your annual usage total— it's public information they're required to share with you.
What is a Power Purchase Agreement (PPA)?
A PPA is a solar financing option where you pay for the electricity your solar panels produce, not the system itself—with $0 upfront costs.
How a PPA Works
A solar company installs panels on your property at no cost to you
You pay a fixed rate per kWh for the electricity the panels produce
The solar company owns and maintains the system
You enjoy lower electricity costs immediately
Escalation Rates Explained
0% Escalation
Your PPA rate stays the same for 25 years—complete predictability and maximum savings as utility rates rise
2.99% Escalation
Your PPA rate increases 2.99% annually—still lower than typical utility increases (5%+), resulting in significant long-term savings
Why Compare PPA Options?
This calculator shows you exactly how much money you'll save by switching from unpredictable utility rates to a solar PPA with fixed or low-escalation pricing. See your 25-year savings instantly.
Calculate Your Savings
Enter your information to compare costs over 25 years
How to use this calculator:
Enter your latest electric bill amount and kWh usage to calculate your current rate
Choose how to calculate your usage (simple, monthly breakdown, yearly total, or home square footage)
Get pricing from solar companies: Request PPA quotes with 0% and/or 2.99% escalation rates
Enter the PPA monthly payment(s) from your quote(s) to compare savings
See your 25-year savings comparison instantly with detailed breakdowns
Note: You can compare one or both PPA options—enter whichever quotes you've received from solar companies.
Client Information
Enter your information
Fill out the form to compare costs
Important Disclaimers
Estimates Only: The calculations provided by this tool are estimates based on the information you provide and are for informational purposes only. Actual costs, savings, and benefits may vary based on numerous factors including but not limited to: actual energy consumption patterns, changes in utility rates, solar system performance, weather conditions, maintenance requirements, and local regulations.
Utility Rate Assumptions: This calculator assumes a 5% annual utility rate increase based on historical averages in Massachusetts. Actual utility rate changes may be higher or lower and can vary significantly by utility company, time period, and regulatory decisions.
No Guarantee: NOVA SYSTEMS USA makes no guarantees, warranties, or representations regarding the accuracy, completeness, or reliability of the calculations or projections provided. Past performance and historical data are not indicative of future results.
Not Financial Advice: This tool does not constitute financial, tax, or legal advice. The results should not be used as the sole basis for making financial decisions. We strongly recommend consulting with qualified financial, tax, and legal advisors before entering into any solar agreement or Power Purchase Agreement.
PPA Terms May Vary: Actual PPA terms, rates, escalation clauses, and conditions are subject to credit approval, system design, site evaluation, and contract negotiation. The rates you enter should come from official quotes provided by solar companies. Not all properties qualify for PPA financing.
System Performance: Solar panel performance can be affected by shading, roof condition, orientation, tilt, weather patterns, equipment degradation, and maintenance. Actual energy production may differ from estimates.
Changes in Circumstances: Changes in federal, state, or local incentives, regulations, net metering policies, or utility rate structures could impact the economics of solar installations and PPAs.
User Responsibility: You are solely responsible for verifying all information entered into this calculator. NOVA SYSTEMS USA is not liable for any decisions made based on the results provided by this tool.
By using this calculator, you acknowledge that you have read and understood these disclaimers. For personalized advice and accurate quotes, please contact NOVA SYSTEMS USA at (508) 474-5501 or hello@novasystemsusa.com to schedule a free consultation and site assessment.